
Comprehensive GBP/USD for October 24, 2023
In this comprehensive analysis, Ultima Markets brings you an insightful breakdown of the GBP/USD for 20th October 2023.
Key Takeaways
- Unemployment rate is the key: The British unemployment rate rose slightly in August, which means that the labor market continues to cool down, reducing inflation to a certain extent. If the unemployment rate continues to rise today, the pound may weaken and fall.
- Economic pressure in the UK: UK PMI data for October will be released this afternoon, which has always been below the 50 boom-bust line in the early stage. Last week’s UK retail sales data and inflation report both showed that economic activity is weakening, and today’s data may still be in the contraction range.
GBP/USD Technical Analysis
GBP/USD Daily Chart Insights

- Stochastic Oscillator: The indicator completed the “golden cross” structure again yesterday, and there is a certain probability that the short-term market will continue to rise.
- Price Action: Last week the bar came out of a bottom structure. In conjunction with the sharp rise yesterday, the bar has formed an evening star combination structure. The market has a probability of continuing to rise.
- Moving average resistance: The current exchange rate is below the 33-day moving average (black line). At the same time, the overall market price and short-term moving average are also below the 200-day moving average (dashed line). Even if it is now experiencing a short-term rise, it cannot be premature to conclude that the reversal of the pound is coming.
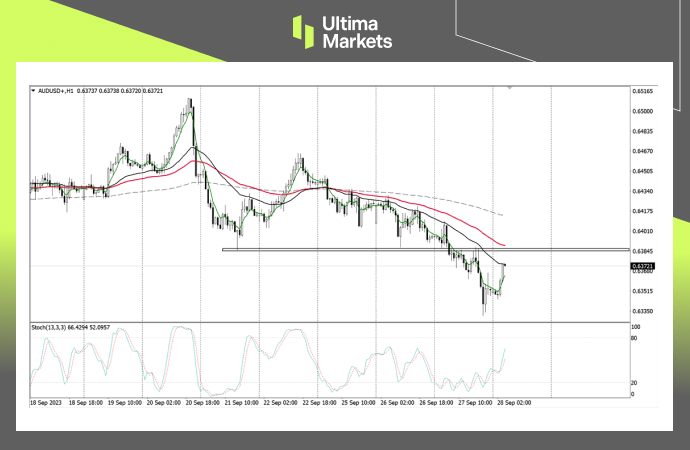
GBP/USD 1-hour Chart Analysis

- Stochastic oscillator: The indicator is entangled in the overbought area. Currently, bulls in the market have the upper hand, and there is some correction pressure on the short-term exchange rate.
- Price action: In the end, the market price broke through the previous lowering highs, the overall downward structure was destroyed, and the intraday market ushered in a reversal. If you want to enter the market with the trend, you need to wait for the retracement structure to appear.
- Elliot wave structure: After the market price quickly broke through the upward channel line yesterday, it can be temporarily judged that driving wave 3 is underway. The support position is the upper edge of the upward channel. After the market falls back, you can look for trading opportunities.
Ultima Markets MT4 Pivot Indicator

- According to the pivot indicator in Ultima Markets MT4, the central price of the day is established at 1.22157,
- Bullish Scenario: Bullish sentiment prevails above 1.22157, first target 1.22890, second target 1.23315;
- Bearish Outlook: In a bearish scenario below 1.22157, first target 1.21739, second target 1.21013.
Conclusion

لماذا تختار تداول المعادن والسلع مع Ultima Markets؟
توفر Ultima Markets البيئة التنافسية الأفضل من حيث التكلفة والتبادل للسلع السائدة في جميع أنحاء العالم.
ابدأ التداولمراقبة فعالة للسوق أثناء تنقلك
الأسواق عرضة للتغيرات في العرض والطلب
جذابة للمستثمرين المهتمين فقط بالمضاربة على الأسعار
سيولة عميقة ومتنوعة بدون رسوم مخفية
لا يوجد مكتب تداول ولا إعادة تسعير
تنفيذ سريع عبر خادم Equinix NY4


شركة Ultima Markets هي عضو في الهيئة المالية، وهي كيان عالمي مكرس لحل النزاعات في سوق الفوركس وعقود الفروقات.
جميع عملاء Ultima Markets محميون تحت تغطية التأمين المقدمة من Willis Towers Watson (WTW)، وسيط تأمين عالمي تأسس في 1828، بأهلية المطالبات تصل إلى 1،000،000 دولار أمريكي لكل حساب.
التجارة معنا
اخطار الإفصاح عن المخاطر
تحذير بشأن المخاطر: ينطوي تداول الفوركس والعقود مقابل الفروقات على مخاطر التعرض لخسارة قد تكون أكبر بكثير من استثمارك الأولي، وبالتالي يجب أن يكون التداول فقط بأموال يمكنك تحمل خسارتها. أنت لا تمتلك أو ليس لديك أي حقوق في الأصول التي تقوم عليها المشتقات (مثل الحق في تلقي مدفوعات الأرباح). يرجى التأكد من فهمك التام للمخاطر التي ينطوي عليها الأمر. قد لا تكون منتجات التداول بالرافعة المالية مناسبة لجميع المستثمرين. قبل الشروع في التداول، يرجى الأخذ في الحسبان مستوى خبرتك وأهدافك الاستثمارية والاستعانة بمشورة مالية مستقلة إذا اقتضى الأمر. يرجى النظر في وثائقنا القانونية والتأكد من فهمك الكامل للمخاطر قبل اتخاذ أي قرارات بالتداول.
تحذير عام: المعلومات الواردة في هذا الموقع الإلكتروني هي معلومات عامة فقط، وإن أي نصيحة وردت ما هي إلا نصيحة عامة، تم إعدادها دون مراعاة أهدافك أو وضعك المالي أو احتياجاتك. وبالتالي، قبل أن تتصرف بناءً على النصيحة، يجب عليك النظر في مدى ملاءمة أي نصيحة مع أهدافك الشخصية ووضعك المالي واحتياجاتك الخاصة، وبعد الإطلاع على المستندات القانونية.
القيود الإقليمية: لا يتم توجيه هذه المعلومات أو الأجهزة في هذا الموقع الإلكتروني أو تقديمها إلى أشخاص مقيمين في ولايات قضائية معينة مثل الولايات المتحدة وكوريا الشمالية وما إلى ذلك. للمزيد من المعلومات يرجى التواصل مع فريق الدعم لدينا.
إن Ultima Markets هو الاسم التجاري لشركة Ultima Markets Ltd، المرخصة والمنظمة من هيئة الخدمات المالية "FSC" في موريشيوس كوسيط استثماري (وكيل خدمات كاملة، باستثناء الاكتتابات) (ترخيص رقم. GB 23201593). عنوان المكتب المسجل: 2nd Floor, The Catalyst, 40 Silicon Avenue, Ebene Cybercity, 72201, Mauritius.
Huaprime EU Ltd, registered number HE423188, and, with a business address at Georgiou Griva Digeni 122A, Kallinicos Court, Shop 1—Upper level, Neapolis, 3101 Limassol, Cyprus, is regulated by the Cyprus Securities and Exchange Commission, which has CIF license number 426/23.
حقوق الطبع والنشر © 2025 شركة Ultima Markets Ltd. كافة الحقوق محفوظة.
-

Messenger


Continue on Messenger
Take the conversation to your Messenger account. You can return anytime.
Scan the QR code and then send the message that appears in your Messenger.
Open Messenger on this device.
-
Instagram
Continue on Instagram
Take the conversation to your Instagram account. You can return anytime.
Scan the QR code to open Instagram. Follow @ultima_markets to send a DM.
Open Instagram on this device.
-
Live Chat
-