Comprehensive USDX Analysis for December 14, 2023
In this comprehensive analysis, Ultima Markets brings you an insightful breakdown of the USDX for 12th December 2023.
USDX Key Takeaways
- The Fed with a clear attitude: In the early hours of Thursday morning, the Federal Reserve announced that it would once again maintain interest rate stability and sent the clearest signal to date that its aggressive interest rate hikes have ended and a series of interest rate cuts are expected next year.
- Confusing dot plot: The dot plot shows that eight officials think there will be less than 75 basis points of rate cuts next year, while five officials expect more. This is the most confusing “dot plot” to come out in years. SEP shows that Fed officials expect a median rate cut of 75 basis points next year, a faster pace than forecast in September.
- Federal Reserve official’s speech: A few hours before the Federal Reserve announced its interest rate decision, U.S. Treasury Secretary Yellen said in an interview with CNBC that it is reasonable for the Federal Reserve to consider cutting interest rates to maintain steady economic growth. Federal Reserve Chairman Jerome Powell said that as inflation continues to fall toward the 2% target, policymakers are now turning their focus to when to cut interest rates.
USDX Technical Analysis
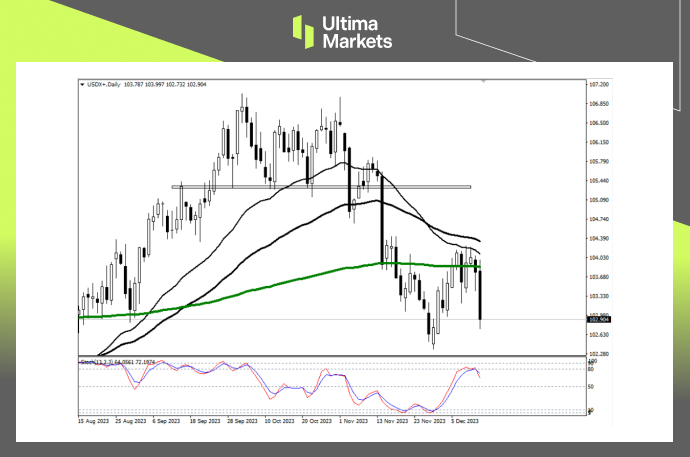
USDX Daily Chart Insights

- Stochastic Oscillator: The indicator sent a short signal in the oversold area yesterday, suggesting that the market may usher in a downward trend.
- Moving average resistance: The 33-day and 65-day moving averages jointly suppressed the U.S. dollar index from further rise, and yesterday’s sharp drop suggested that the bulls’ power has subsided, focusing on short trading opportunities.
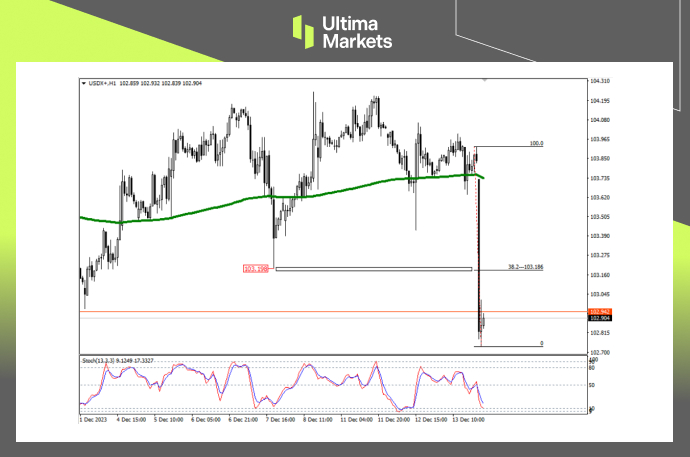
USDX 1-hour Chart Analysis

- Stochastic oscillator: The indicator has fallen and entered the oversold area. Wait for the indicator to leave the oversold area and send out a short signal again before paying attention to short trading opportunities.
- Fibonacci retracement level: USDX fell rapidly yesterday, and sellers had some motivation to sell and leave. In theory, after a rapid trend, the first target for correction is the 38.2% Fibonacci retracement level. This price is also the previous low support level of 103.198.
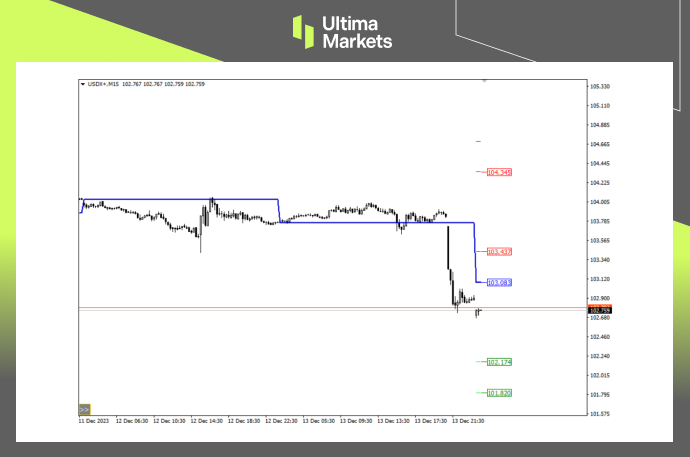
Ultima Markets MT4 Pivot Indicator

- According to the pivot indicator in Ultima Markets MT4, the central price of the day is established at 103.083,
- Bullish Scenario: Bullish sentiment prevails above 103.083, first target 103.437, second target 104.345;
- Bearish Outlook: In a bearish scenario below 103.083, first target 102.174, second target 101.820.
Conclusion
To navigate the complex world of trading successfully, it’s imperative to stay informed and make data-driven decisions. Ultima Markets remains dedicated to providing you with valuable insights to empower your financial journey.
For personalized guidance tailored to your specific financial situation, please do not hesitate to contact Ultima Markets.
Join Ultima Markets today and access a comprehensive trading ecosystem equipped with the tools and knowledge needed to thrive in the financial markets.
Stay tuned for more updates and analyses from our team of experts at Ultima Markets.
Disclaimer
Comments, news, research, analysis, price, and all information contained in the article only serve as general information for readers and do not suggest any advice. Ultima Markets has taken reasonable measures to provide up-to-date information, but cannot guarantee accuracy, and may modify without notice. Ultima Markets will not be responsible for any loss incurred due to the application of the information provided.
Copyright © 2023 Ultima Markets Ltd. All rights reserved.
ทําไมต้องซื้อขายโลหะมีค่าและสินค้าโภคภัณฑ์กับ Ultima Markets?
Ultima Markets ให้บริการด้วยต้นทุนที่เหมาะสมแข่งขันได้ในสภาพแวดล้อมการซื้อขายที่ดีที่สุดสำหรับสินค้าที่เป็นที่นิยมแพร่หลายทั่วโลก
เริ่มการซื้อขายตรวจสอบความเป็นไปของตลาด
ตลาดมีความอ่อนไหวต่อการเปลี่ยนแปลงของอุปสงค์และอุปทาน
ดึงดูดนักลงทุนที่สนใจเฉพาะการเก็งกําไรราคา
สภาพคล่องที่สูงและหลากหลายโดยไม่มีค่าธรรมเนียมแอบแฝง
ไม่มี dealing desk และไม่มี requotes
การดําเนินการที่รวดเร็วผ่านเซิร์ฟเวอร์ Equinix NY4


