You are visiting the website that is operated by Ultima Markets Ltd, a licensed investment firm by the Financial Services Commission “FSC” of Mauritius, under license number GB 23201593. Please be advised that Ultima Markets Ltd does not have legal entities in the European Union.
If you wish to open an account in an EU investment firm and protected by EU laws, you will be redirected to Ultima Markets Cyprus Ltd (the “CIF”), a Cyprus investment firm duly licensed and regulated by the Cyprus Securities and Exchange Commission with license number 426/23.
Comprehensive USD/CNH Analysis for September 22, 2023
In this comprehensive analysis, Ultima Markets brings you an insightful breakdown of the USD/CNH for 22nd September 2023.
Key Takeaways
The Federal Reserve’s Decision: In September, the Federal Reserve made a pivotal decision to halt interest rate hikes. The dot plot hints at the possibility of future rate increases.
Furthermore, the overall monetary policy for the upcoming year leans towards a more hawkish stance, with a shift from an anticipated 5 interest rate cuts to just 2.
These factors collectively maintain the US dollar’s dominance, momentarily placing non-US currencies at a disadvantage.
USD/CNH Technical Analysis
USD/CNH Daily Chart Signals
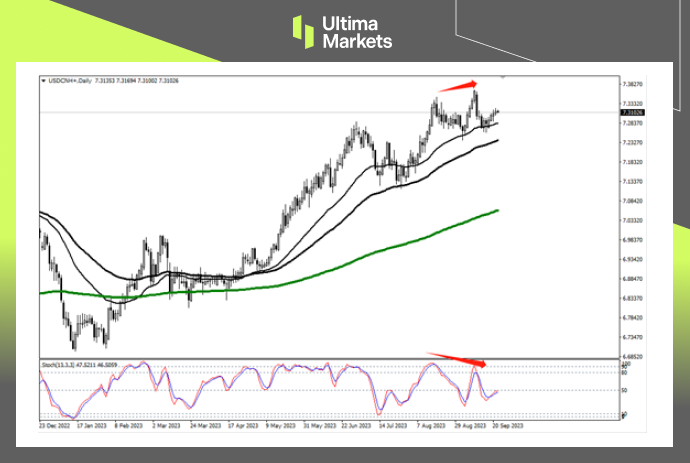
(Daily chart of USD/CNH, source: Ultima Markets MT4)
Rebound and Candle Pattern: Our analysis of the daily chart reveals an interesting rebound in the USD/CNH pair after reaching the 33-day moving average.
This rebound pattern closely resembles a head and shoulders candle formation. This chart development signifies a potential right shoulder formation.
USD/CNH 4-Hour Chart Dynamics
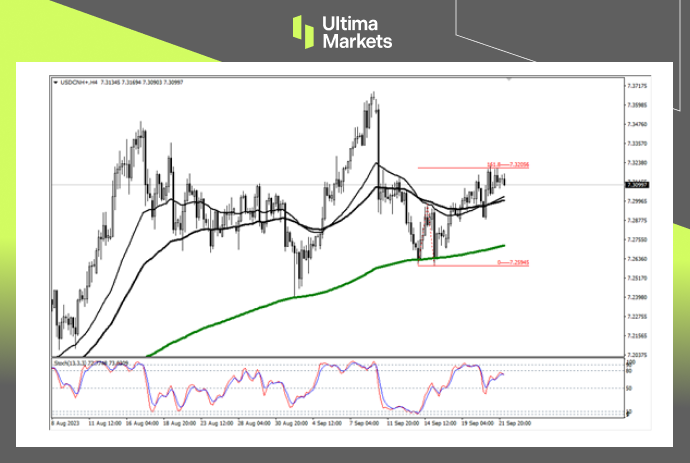
(4-hour chart of USD/CNH, source: Ultima Markets MT4)
Rebound Magnitude: Transitioning to the 4-hour chart, we observe that the recent rebound of USD/CNH has reached a significant level, approximately 1.618 times the rebound height recorded on September 14.
It is vital to keep a close watch on market movement below the 65-period moving average to gain insights into the conclusion of the market rebound.
Insights from the 1-Hour Chart
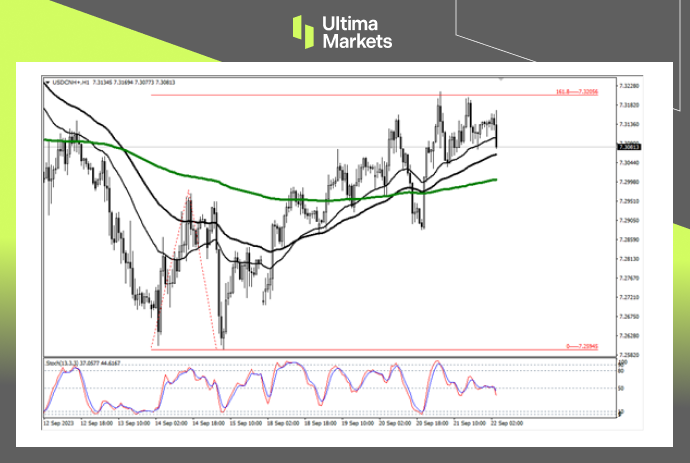
(1-hour chart of USD/CNH, source: Ultima Markets MT4)
Equilibrium in the Market: On the 1-hour chart, the moving average remains a pivotal support for the market.
The stochastic oscillator hovers around the middle area at 50, indicating an equilibrium between bullish and bearish sentiments.
To confirm the initiation of short positions, a market movement below the moving average group is crucial.
Ultima Markets Pivot Indicator
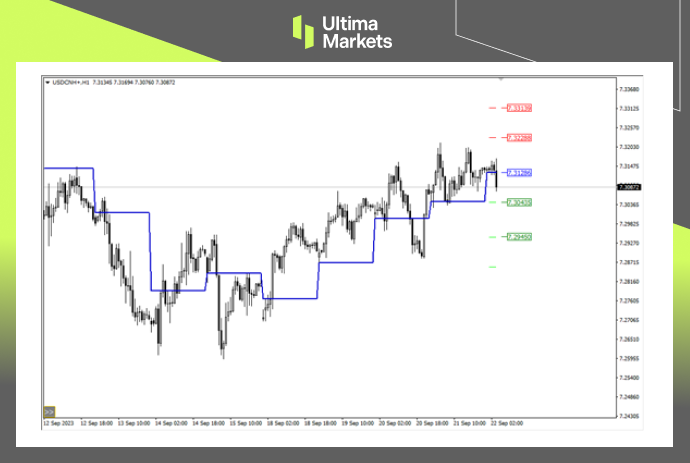
(1-hour chart of USD/CNH, source: Ultima Markets MT4)
Key Price Level: According to the pivot indicator in Ultima Markets MT4, the central price for the day stands at 7.31286.
A bullish sentiment prevails above this level, with the first target at 7.32288 and the second target at 7.33139.
Conversely, a bearish stance is favored below 7.31286, with the first target at 7.30435 and the second target at 7.29450.
Conclusion
لماذا تختار تداول المعادن والسلع مع Ultima Markets؟
توفر Ultima Markets البيئة التنافسية الأفضل من حيث التكلفة والتبادل للسلع السائدة في جميع أنحاء العالم.
ابدأ التداولمراقبة فعالة للسوق أثناء تنقلك
الأسواق عرضة للتغيرات في العرض والطلب
جذابة للمستثمرين المهتمين فقط بالمضاربة على الأسعار
سيولة عميقة ومتنوعة بدون رسوم مخفية
لا يوجد مكتب تداول ولا إعادة تسعير
تنفيذ سريع عبر خادم Equinix NY4


