You are visiting the website that is operated by Ultima Markets Ltd, a licensed investment firm by the Financial Services Commission “FSC” of Mauritius, under license number GB 23201593. Please be advised that Ultima Markets Ltd does not have legal entities in the European Union.
If you wish to open an account in an EU investment firm and protected by EU laws, you will be redirected to Ultima Markets Cyprus Ltd (the “CIF”), a Cyprus investment firm duly licensed and regulated by the Cyprus Securities and Exchange Commission with license number 426/23.
Comprehensive EUR/NZD Analysis for October 13, 2023
In this comprehensive analysis, Ultima Markets brings you an insightful breakdown of the EUR/NZD for 13th October 2023.
U.S. CPI Rose: U.S. CPI rose for the second consecutive month in…..
Key Takeaways
- U.S. CPI Rose: U.S. CPI rose for the second consecutive month in September, which may support the Federal Reserve’s intention to keep interest rates higher for a longer period of time.
- New Zealand Manufacturing Index: New Zealand’s manufacturing performance index continued to decline in September, with the index in September being 45.3, compared with the previous value of 46.1. It highlights that New Zealand’s manufacturing industry remains sluggish.
- Speech by the chairman of the RBNZ: Governor Adrian Orr recently stated that the RBNZ interest rates need to remain tight in the foreseeable future. This lowered previous market expectations that the RBNZ would keep interest rates unchanged in November.
EUR/NZD Technical Analysis
EUR/NZD Daily Chart Insights

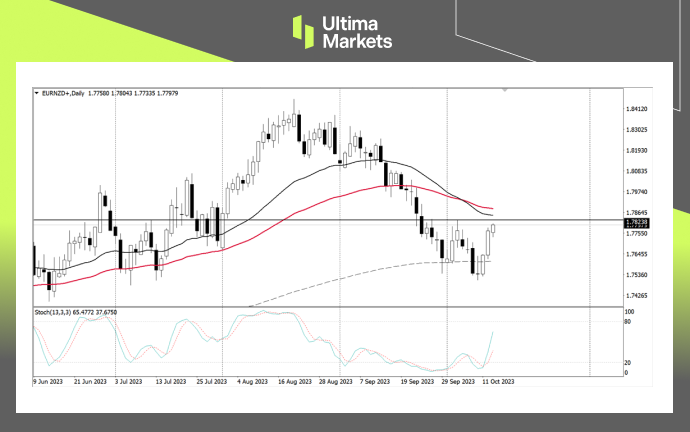
- Price action: The price finally breakthrough pin bar above. As analyzed on Wednesday, the market will most likely start a bullish trend this week, and is about to form a “W-shaped” bottom structure.
- Moving average: From the perspective of moving average technical indicators, the exchange rate was eventually blocked and rebounded on the 240-day moving average. The 33-day and 63-day moving average is near the resistance area of 1.78238. There is a certain probability that the exchange rate will be blocked and adjusted today.
EUR/NZD 4-Hour Chart Analysis

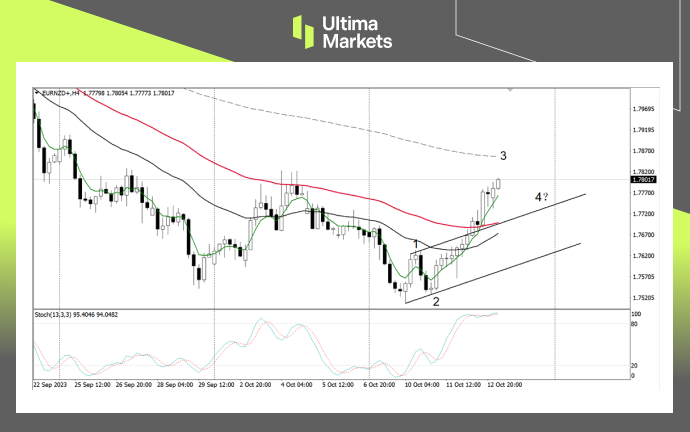
- Stochastic Oscillator: Technical indicators show that the market has been seriously overbought, and the market has strong motivation to adjust.
- Moving average: Above the price is the 200-period moving average. Similar to the daily chart, the combined resistance area will suppress the exchange rate from rising further.
- Elliot Wave: The rapid rise since yesterday is currently judged to be motive wave 3. After the correction, the exchange rate has a certain probability of stepping back on the upper edge of the upward channel. It is also the moving average support level in the 65 and 33 period areas.
Pivot Indicator

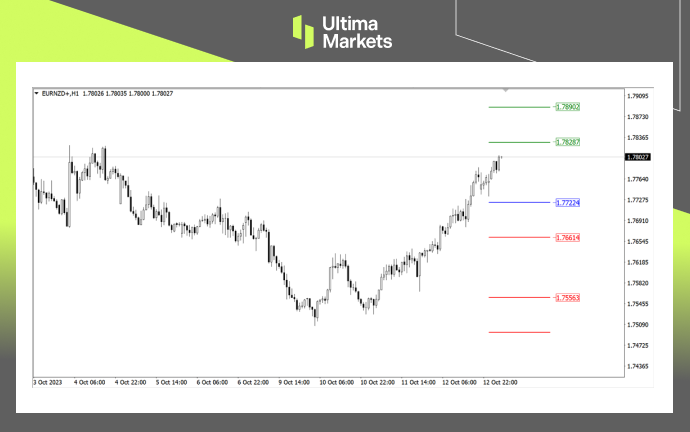
- According to the pivot indicator in Ultima Markets MT4, the central price of the day is established at 1.77224,
- Bullish Scenario: Bullish sentiment prevails above 1.77224, the first target is 1.78287, the second target is 1.78902.
- Bearish Outlook: In a bearish scenario below 1.77224, first target 1.76614, second target 1.75563.
Conclusion
Legal Documents
Ultima Markets, a trading name of Ultima Markets Ltd, is authorized and regulated by the Financial Services Commission “FSC” of Mauritius as an Investment Dealer (Full-Service Dealer, excluding Underwriting) (license No. GB 23201593). The registered office address: 2nd Floor, The Catalyst, 40 Silicon Avenue, Ebene Cybercity, 72201, Mauritius.
Disclaimer
Comments, news, research, analysis, price, and all information contained in the article only serve as general information for readers and do not suggest any advice. Ultima Markets has taken reasonable measures to provide up-to-date information, but cannot guarantee accuracy, and may modify without notice. Ultima Markets will not be responsible for any loss incurred due to the application of the information provided.
Copyright © 2023 Ultima Markets Ltd. All rights reserved.
Vì sao chọn giao dịch Kim loại & Hàng hóa với Ultima Markets?
Ultima Markets cung cấp điều kiện giao dịch và chi phí cạnh tranh hàng đầu cho các mặt hàng phổ biến trên toàn thế giới.
Bắt đầu giao dịchTheo dõi thị trường mọi lúc mọi nơi
Thị trường dễ bị ảnh hưởng bởi những thay đổi về cung và cầu
Hấp dẫn với các nhà đầu tư chỉ quan tâm đến đầu cơ giá
Thanh khoản sâu và đa dạng, không có phí ẩn
Không qua môi giới tạo lập thị trương, không báo giá lại
Khớp lệnh nhanh chóng thông qua máy chủ Equinix NY4


